Multiple Choice
FIGURE 5-2
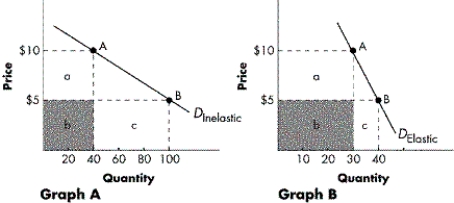
-Refer to Figure 5-2. Compared to Graph A, what type of demand curve does Graph B represent?
A) a unit inelastic curve
B) a relatively elastic curve
C) a relatively inelastic curve
D) a unit elastic curve
Correct Answer:

Verified
Correct Answer:
Verified
Related Questions
Q72: What term accurately describes demand when the
Q73: Bailey's Barber Shop knows that a 5
Q74: A 10 percent decrease in the price
Q75: As you move down (southeast) along a
Q76: The government proposes a tax on flowers
Q80: A tax is imposed on wine. Under
Q81: A recent study at a liberal arts
Q82: FIGURE 5-1<br> <img src="https://d2lvgg3v3hfg70.cloudfront.net/TB5767/.jpg" alt="FIGURE 5-1
Q101: A perfectly inelastic supply curve is vertical.
Q223: A decrease in price will cause a