True/False
According to the stem-and-leaf plot below, this data set is symmetric. 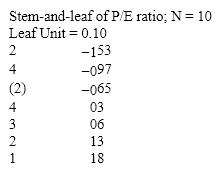
Correct Answer:

Verified
Correct Answer:
Verified
Related Questions
Q4: Car Buyers Forty car buyers were asked
Q5: If we draw a straight line through
Q6: Business School Graduates A sample of business
Q7: Data for calories and salt content (milligrams
Q10: Electronics Company At a meeting of regional
Q25: Bar and pie charts are graphical techniques
Q28: A pie chart shows the _ of
Q48: The classification of student major (accounting,economics,management,marketing,other)is an
Q90: A bar chart is used to represent
Q102: If the data in a scatter diagram