Essay
Business School Graduates A sample of business school graduates were asked what their major was. The results are shown in the following frequency distribution. 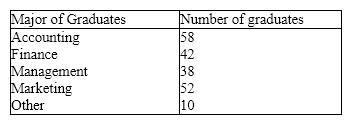 {Business School Graduates Narrative} Draw a pie chart to summarize this data. Which major was the most popular?
Correct Answer:

Verified
 The most popular ma...
View Answer
Unlock this answer now
Get Access to more Verified Answers free of charge
Correct Answer:
Verified
View Answer
Unlock this answer now
Get Access to more Verified Answers free of charge
Q1: Business School Graduates A sample of business
Q2: Forty truck buyers were asked to indicate
Q4: Car Buyers Forty car buyers were asked
Q5: If we draw a straight line through
Q7: Data for calories and salt content (milligrams
Q8: According to the stem-and-leaf plot below, this
Q10: Electronics Company At a meeting of regional
Q25: Bar and pie charts are graphical techniques
Q90: A bar chart is used to represent
Q102: If the data in a scatter diagram