True/False
The scatter diagram below depicts data with a negative linear relationship. 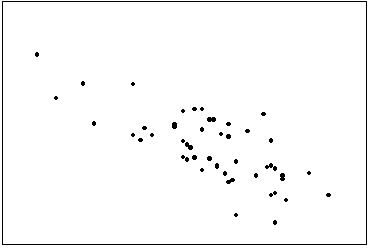
Correct Answer:

Verified
Correct Answer:
Verified
Related Questions
Q11: The number of class intervals in a
Q13: A pie chart is used to represent
Q37: The two most important characteristics to look
Q91: A researcher wishes to estimate the textbook
Q104: The relative frequency of a class in
Q138: {Test Grade Narrative} Construct a relative frequency
Q144: Which of the following statements describe(s)the line
Q145: {Business School Graduates Narrative} If you were
Q146: Compare the spread of the two histograms
Q150: Internet Classes A survey of 25 students