Multiple Choice
Which of the following statements describe(s) the line chart below? 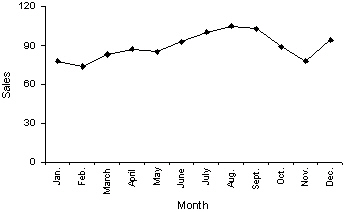
A) November experienced the lowest sales throughout the year.
B) August experienced the highest sales throughout the year.
C) Sales did not fluctuate more than 30 units on either side of 90.
D) All of these choices are true.
Correct Answer:

Verified
Correct Answer:
Verified
Q1: The original observations cannot be determined once
Q13: A pie chart is used to represent
Q33: A variable is some characteristic of a
Q121: When a distribution has more values to
Q138: {Test Grade Narrative} Construct a relative frequency
Q141: Insurance Company A representative from a local
Q142: Compare the two histograms below. Which statement
Q145: {Business School Graduates Narrative} If you were
Q146: Compare the spread of the two histograms
Q149: The scatter diagram below depicts data with