True/False
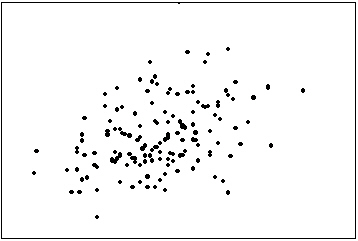
The first scatter diagram below shows a stronger linear relationship than the second scatter diagram. (Assume the scales on both scatter diagrams are the same.) 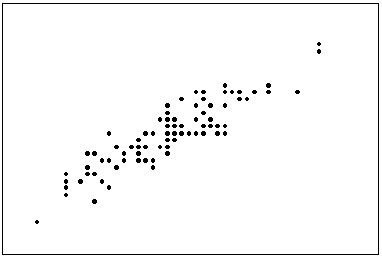
Correct Answer:

Verified
Correct Answer:
Verified
Related Questions
Q9: Observations that are measured at the same
Q9: Interval data, such as heights, weights, and
Q23: Give an example of interval data that
Q54: Which of the following represents time-series data?<br>A)The
Q67: All calculations are permitted on what type
Q77: The two most important characteristics to examine
Q86: Before leaving a particular restaurant,customers are asked
Q105: Experience shows that few students hand in
Q110: Briefly explain the difference between correlation and
Q117: The line chart below shows potato prices