Short Answer
The line chart below shows potato prices per pound for each month from January (month 1)to December last year. By looking at this chart you can see the lowest potato prices occurred in ____________________. 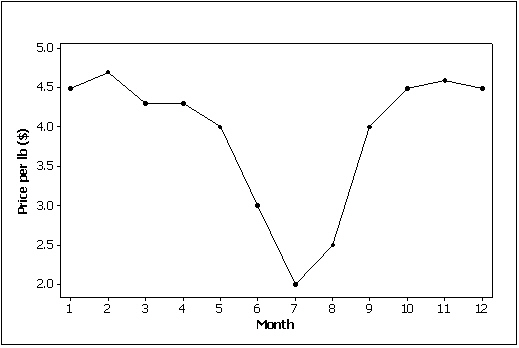
Correct Answer:

Verified
Correct Answer:
Verified
Related Questions
Q2: When a distribution has more values to
Q23: Give an example of interval data that
Q54: Which of the following represents time-series data?<br>A)The
Q67: All calculations are permitted on what type
Q86: Before leaving a particular restaurant,customers are asked
Q105: Experience shows that few students hand in
Q110: Briefly explain the difference between correlation and
Q114: The first scatter diagram below shows a
Q117: The sum of the relative frequencies for
Q148: A stem-and-leaf display represents nominal data.