Multiple Choice
What type of graph depicts the data below? 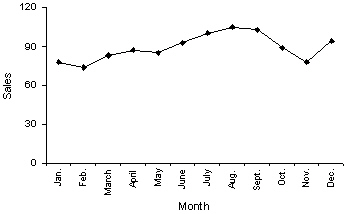
A) A line chart
B) A histogram
C) A dot plot
D) A bar chart
Correct Answer:

Verified
Correct Answer:
Verified
Related Questions
Q12: A category in a pie chart that
Q15: The final grade received in a Literature
Q43: Test Grades The scores on a calculus
Q45: Time series data are often graphically depicted
Q93: All calculations are permitted on interval data.
Q98: Observations that are taken during successive points
Q109: The graphical technique used to describe the
Q111: Time-series data are often graphically depicted how?<br>A)Bar
Q133: It is speculated that the number of
Q144: In applications involving two variables,X and Y,where