Essay
Test Grades The scores on a calculus test for a random sample of 40 students are as follows: 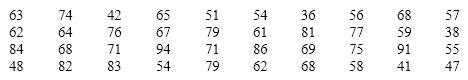 {Test Grades Narrative} Construct a stem-and-leaf display for this data set. Describe the shape of the data.
Correct Answer:

Verified
Correct Answer:
Verified
Related Questions
Q6: Two types of graphs that organize nominal
Q12: A category in a pie chart that
Q15: Which of the following describes a positive
Q45: What type of graph depicts the data
Q93: All calculations are permitted on interval data.
Q98: Observations that are taken during successive points
Q109: The graphical technique used to describe the
Q111: Time-series data are often graphically depicted how?<br>A)Bar
Q133: It is speculated that the number of
Q144: In applications involving two variables,X and Y,where