Essay
Suppose you measure the number of minutes it takes an employee to complete a task, where the maximum allowed time is 5 minutes, and each time is rounded to the nearest minute. Data from 130 employees is summarized below. Construct a frequency bar chart and a pie chart from this data. How long did it take most employees to complete the task? 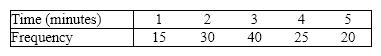
Correct Answer:

Verified
 The most common time to comp...
View Answer
Unlock this answer now
Get Access to more Verified Answers free of charge
Correct Answer:
Verified
View Answer
Unlock this answer now
Get Access to more Verified Answers free of charge
Q21: Observations that are measured at the same
Q25: {Teachers Ages Narrative} Draw a frequency histogram
Q36: Which of the following statements about pie
Q58: A supermarket's monthly sales (in thousands of
Q61: Electronics Company At a meeting of regional
Q66: For each of the following, indicate whether
Q68: Which of the following statements is false?<br>A)You
Q75: The relationship between two interval variables is
Q83: A modal class in a histogram is
Q89: In purchasing an automobile,there are a number