Essay
A supermarket's monthly sales (in thousands of dollars)for the last year were as follows: 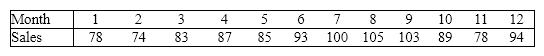 Construct a relative frequency bar chart for this data set. How many observations are there in this data set?
Correct Answer:

Verified
See the graph below. There are...View Answer
Unlock this answer now
Get Access to more Verified Answers free of charge
Correct Answer:
Verified
View Answer
Unlock this answer now
Get Access to more Verified Answers free of charge
Q25: {Teachers Ages Narrative} Draw a frequency histogram
Q44: Provide one example of ordinal data; one
Q54: An economics professor wants to study the
Q57: Internet Classes A survey of 25 students
Q61: Electronics Company At a meeting of regional
Q63: Suppose you measure the number of minutes
Q75: The relationship between two interval variables is
Q89: In purchasing an automobile,there are a number
Q98: The sum of cumulative relative frequencies always
Q151: In a histogram a(n)_ class is the