Essay
Aptitude Test Scores Two random samples of 40 students were drawn independently from two populations of students. Assume their aptitude tests are normally distributed (total points = 100). The following statistics regarding their scores in an aptitude test were obtained: 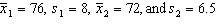 . {Aptitude Test Scores Narrative} Explain how to use the 95% confidence interval to test the hypotheses at a = .05.
Correct Answer:

Verified
Since the hypothesized value 0...View Answer
Unlock this answer now
Get Access to more Verified Answers free of charge
Correct Answer:
Verified
View Answer
Unlock this answer now
Get Access to more Verified Answers free of charge
Q6: In testing for the differences between the
Q15: The number of degrees of freedom associated
Q25: If some natural relationship exists between each
Q31: A matched pairs experiment decreases variability (compared
Q75: Promotional Campaigns The general manager of a
Q80: When comparing two population means using data
Q81: Starting Salary In testing the hypotheses <img
Q83: The expected value of <img src="https://d2lvgg3v3hfg70.cloudfront.net/TBX8689/.jpg" alt="The
Q90: In testing the difference between two population
Q116: Unless we can conclude that the population