Multiple Choice
Exhibit 17-2 Aggregate demand and aggregate supply curves 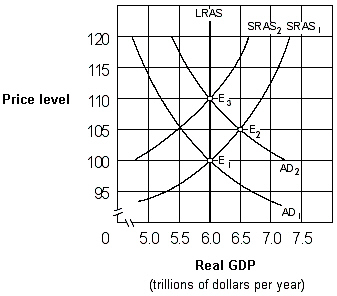 As shown in Exhibit 17-2, if people behave according to adaptive expectations theory, an increase in the aggregate demand curve from AD1 to AD2 will cause the price level to move:
A) directly from 100 to 110 and then remain at 110.
B) directly from 100 to 105 and then remain at 105.
C) from 100 to 105 initially and then eventually move back to 100.
D) from 100 to 105 initially and then eventually move to 110.
Correct Answer:

Verified
Correct Answer:
Verified
Q19: Explain why rational expectations theorists do not
Q43: What is the difference between the Keynesian
Q58: The rational expectations hypothesis indicates that people<br>A)
Q66: Exhibit 17-2 Aggregate demand and aggregate supply
Q67: The Phillips curve shows a negative relationship
Q70: According to the natural rate hypothesis, the
Q73: Which of the following is not an
Q74: The long-run Phillips curve:<br>A)is horizontal.<br>B)is the same
Q75: A Phillips curve shows the relationship between
Q106: The view that individuals weigh all available