Multiple Choice
Exhibit 17-2 Aggregate demand and aggregate supply curves 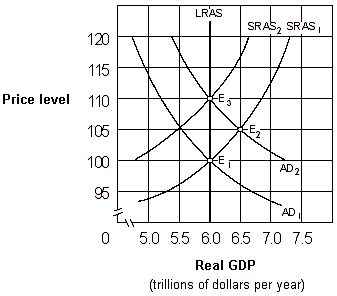 As shown in Exhibit 17-2, if people behave according to rational expectations theory, an increase in the aggregate demand curve from AD1 to AD2 will cause the price level to move:
A) directly from 100 to 105 and then remain at 105.
B) directly from 100 to 110 and then remain at 110.
C) from 100 to 105 initially and then eventually move back to 100.
D) from 100 to 105 initially and then eventually move to 110.
Correct Answer:

Verified
Correct Answer:
Verified
Q19: Explain why rational expectations theorists do not
Q61: Compliance with wage and price controls by
Q62: Under adaptive expectations theory, people expect the
Q64: Incorporation of expectations into economic decision making
Q65: During the 1970s, the inflation rate and
Q67: The Phillips curve shows a negative relationship
Q70: According to the natural rate hypothesis, the
Q71: Exhibit 17-2 Aggregate demand and aggregate supply
Q86: The adaptive expectations hypothesis implies that people<br>A)
Q106: The view that individuals weigh all available