Multiple Choice
Figure 2-7
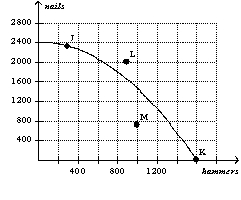
-Refer to Figure 2-7.Which point on the graph best represents the fact that,because resources are scarce,not every conceivable outcome is feasible?
A) point J
B) point K
C) point L
D) point M
Correct Answer:

Verified
Correct Answer:
Verified
Q16: A duty of economists at the Department
Q25: A relatively flat demand curve indicates that<br>A)quantity
Q45: Deciding that A causes B when in
Q65: Positive statements are<br>A)prescriptive.<br>B)claims about how the world
Q159: "Society would be better off if the
Q168: When a production possibilities frontier is bowed
Q178: Figure 2-16<br>In the following graph the x-axis
Q181: Figure 2-8<br> <img src="https://d2lvgg3v3hfg70.cloudfront.net/TB2185/.jpg" alt="Figure 2-8
Q192: In the circular-flow diagram,<br>A)firms are buyers in
Q195: There is only one explanation for why