Multiple Choice
Figure 2-16
In the following graph the x-axis shows the number of times a commuter rail train stops at a station per hour and the y-axis shows the number of commuter rail passengers per hour.
Commuter Rail Passengers by Frequency of Service
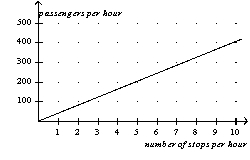
-Refer to Figure 2-16.Which of the following conclusions should not be drawn from observing this graph?
A) There is a positive correlation between the frequency of service and the number of passengers.
B) When there are 5 stops per hour, there are approximately 200 passengers.
C) More stops per hour is associated with more passengers per hour.
D) No other factors besides the frequency of service affect the number of passengers.
Correct Answer:

Verified
Correct Answer:
Verified
Q25: A relatively flat demand curve indicates that<br>A)quantity
Q45: Deciding that A causes B when in
Q61: Which of the following is not an
Q85: The slope of an upward-sloping line is
Q159: "Society would be better off if the
Q165: Economists believe that production possibilities frontiers are
Q168: When a production possibilities frontier is bowed
Q181: Figure 2-8<br> <img src="https://d2lvgg3v3hfg70.cloudfront.net/TB2185/.jpg" alt="Figure 2-8
Q182: Figure 2-7<br> <img src="https://d2lvgg3v3hfg70.cloudfront.net/TB2185/.jpg" alt="Figure 2-7
Q209: The essence of science is<br>A)the laboratory experiment.<br>B)the