Multiple Choice
Figure 8-7
The vertical distance between points A and B represents a tax in the market.
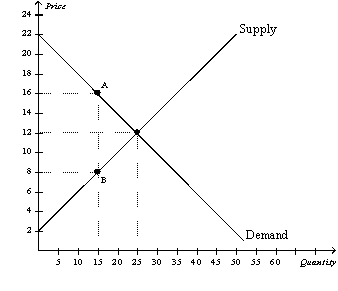
-Refer to Figure 8-7.The deadweight loss associated with this tax amounts to
A) $60, and this figure represents the amount by which tax revenue to the government exceeds the combined loss of producer and consumer surpluses.
B) $60, and this figure represents the surplus that is lost because the tax discourages mutually advantageous trades between buyers and sellers.
C) $40, and this figure represents the amount by which tax revenue to the government exceeds the combined loss of producer and consumer surpluses.
D) $40, and this figure represents the surplus that is lost because the tax discourages mutually advantageous trades between buyers and sellers.
Correct Answer:

Verified
Correct Answer:
Verified
Q1: To fully understand how taxes affect economic
Q20: If the labor supply curve is nearly
Q23: Figure 8-2<br>The vertical distance between points A
Q41: Assume the supply curve for cigars is
Q42: Figure 8-13<br> <img src="https://d2lvgg3v3hfg70.cloudfront.net/TB2185/.jpg" alt="Figure 8-13
Q43: Figure 8-14<br> <img src="https://d2lvgg3v3hfg70.cloudfront.net/TB2185/.jpg" alt="Figure 8-14
Q45: Figure 8-11<br> <img src="https://d2lvgg3v3hfg70.cloudfront.net/TB2185/.jpg" alt="Figure 8-11
Q50: Diana is a personal trainer whose client
Q79: Figure 8-8<br>Suppose the government imposes a $10
Q124: Economist Arthur Laffer made the argument that