Multiple Choice
Figure 8-13
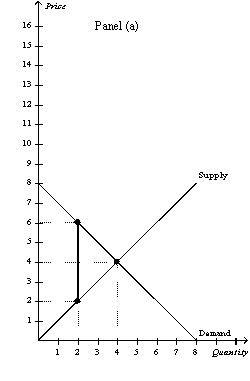
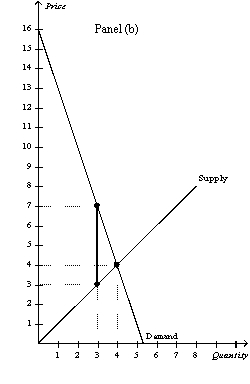
-Refer to Figure 8-13.Panel (a) and Panel (b) each illustrate a $4 tax placed on a market.In comparison to Panel (b) ,Panel (a) illustrates which of the following statements?
A) When demand is relatively inelastic, the deadweight loss of a tax is smaller than when demand is relatively elastic.
B) When demand is relatively elastic, the deadweight loss of a tax is larger than when demand is relatively inelastic.
C) When supply is relatively inelastic, the deadweight loss of a tax is smaller than when supply is relatively elastic.
D) When supply is relatively elastic, the deadweight loss of a tax is larger than when supply is relatively inelastic.
Correct Answer:

Verified
Correct Answer:
Verified
Q1: To fully understand how taxes affect economic
Q20: If the labor supply curve is nearly
Q38: The demand for potted plants is more
Q39: Figure 8-16<br> <img src="https://d2lvgg3v3hfg70.cloudfront.net/TB2185/.jpg" alt="Figure 8-16
Q40: Which of the following ideas is the
Q41: Assume the supply curve for cigars is
Q43: Figure 8-14<br> <img src="https://d2lvgg3v3hfg70.cloudfront.net/TB2185/.jpg" alt="Figure 8-14
Q45: Figure 8-11<br> <img src="https://d2lvgg3v3hfg70.cloudfront.net/TB2185/.jpg" alt="Figure 8-11
Q46: Figure 8-7<br>The vertical distance between points A
Q187: If the size of a tax increases,