Figure 21-19 The Following Graph Illustrates a Representative Consumer's Preferences for Marshmallows
Multiple Choice
Figure 21-19
The following graph illustrates a representative consumer's preferences for marshmallows and chocolate chip cookies:
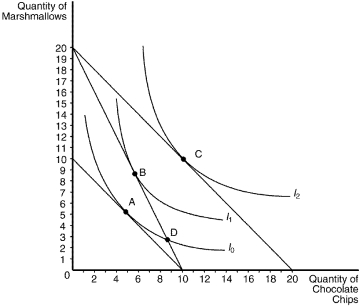
-Refer to Figure 21-19.Assume that the consumer depicted the figure has an income of $50.Based on the information available in the graph,which of the following price-quantity combinations would be on her demand curve for chocolate chips if the price of marshmallows is $2.50?
A) P=$2.50, Q=6
B) P=$2.50, Q=10
C) P=$5.00, Q=3
D) P=$5.00, Q=5
Correct Answer:

Verified
Correct Answer:
Verified
Q29: Consider the indifference curve map and budget
Q166: Figure 21-11 <img src="https://d2lvgg3v3hfg70.cloudfront.net/TB1273/.jpg" alt="Figure 21-11
Q237: A Giffen good is a good for
Q246: Which of the following is not correct?<br>A)An
Q355: Figure 21-19<br>The following graph illustrates a representative
Q361: The theory of consumer choice explains how
Q364: The following diagram shows one indifference curve
Q445: Suppose a consumer spends his income on
Q488: Figure 21-14 <img src="https://d2lvgg3v3hfg70.cloudfront.net/TB1273/.jpg" alt="Figure 21-14
Q535: When indifference curves are bowed in toward