Multiple Choice
Figure 53-4 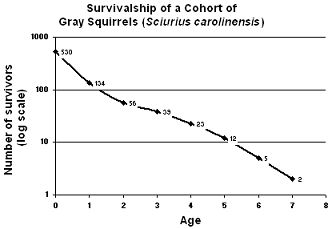
The accompanying figure is representative of:
A) exponential growth.
B) iteroparity.
C) Type I survivorship.
D) Type III survivorship.
E) Type II survivorship.
Correct Answer:

Verified
Correct Answer:
Verified
Q64: Compare and contrast r -selected and K
Q65: K strategists typically produce large numbers of
Q66: Oysters have a(n) Type-II survivorship curve.
Q67: Differentiate between density-dependent and density-independent factors affecting
Q68: A population that is divided into several
Q70: Which of the following is an INCORRECT
Q71: Match the population-influencing factor or definition with
Q72: A density-dependent factor is an example of
Q73: Figure 53-6 <br><img src="https://d2lvgg3v3hfg70.cloudfront.net/TBX8678/.jpg" alt="Figure 53-6
Q74: Match the population-influencing factor or definition with