Multiple Choice
Figure 53-6 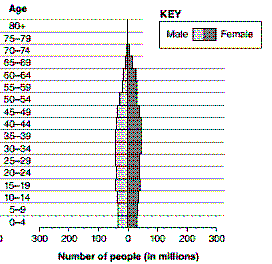
Figure 53-6 represents the age structure diagram of:
A) the transition stage.
B) the preindustrial state.
C) a moderately developed country.
D) a developing country.
E) a highly developed country.
Correct Answer:

Verified
Correct Answer:
Verified
Q68: A population that is divided into several
Q69: Figure 53-4 <br><img src="https://d2lvgg3v3hfg70.cloudfront.net/TBX8678/.jpg" alt="Figure 53-4
Q70: Which of the following is an INCORRECT
Q71: Match the population-influencing factor or definition with
Q72: A density-dependent factor is an example of
Q74: Match the population-influencing factor or definition with
Q75: Species that exhibit repeated reproductive cycles are
Q76: Which of the following pairs is incorrectly
Q77: Explain how environmental degradation is related to
Q78: Iteroparity is common in which of the