Multiple Choice
Figure 53-3 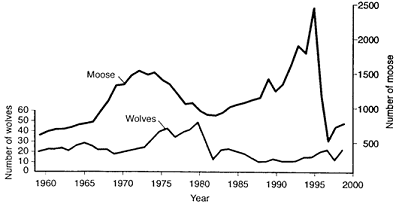 Based on the accompanying figure, the decline in the moose population in 1996 was most likely due to a(n) :
A) predictable increase in the wolf population.
B) unpredictable increase in the wolf population.
C) decrease in the intrinsic rate of increase for the moose population.
D) decline in the food supply.
E) unknown disease organism.
Correct Answer:

Verified
Correct Answer:
Verified
Q34: The best definition of population density is
Q38: Clumped dispersion is often influenced by:<br>A) the
Q45: An exponential growth curve has a J
Q50: The percentages of a population at different
Q64: Compare and contrast r -selected and K
Q75: Two members of the same species compete
Q77: Figure 53-4 <img src="https://d2lvgg3v3hfg70.cloudfront.net/TBX8677/.jpg" alt="Figure 53-4
Q80: _ are good habitats where local reproductive
Q81: Iteroparity is common in which of the
Q97: An exponential growth curve levels off at