Multiple Choice
Figure 53-4 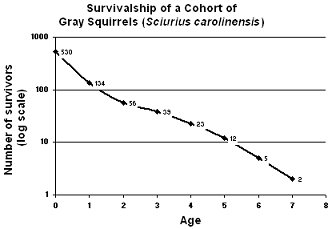 The accompanying figure is representative of:
A) exponential growth.
B) iteroparity.
C) Type I survivorship.
D) Type III survivorship.
E) Type II survivorship.
Correct Answer:

Verified
Correct Answer:
Verified
Q34: The best definition of population density is
Q38: Clumped dispersion is often influenced by:<br>A) the
Q45: An exponential growth curve has a J
Q50: The percentages of a population at different
Q72: Figure 53-4 <img src="https://d2lvgg3v3hfg70.cloudfront.net/TBX8677/.jpg" alt="Figure 53-4
Q75: Two members of the same species compete
Q78: Figure 53-3 <img src="https://d2lvgg3v3hfg70.cloudfront.net/TBX8677/.jpg" alt="Figure 53-3
Q80: _ are good habitats where local reproductive
Q81: Iteroparity is common in which of the
Q97: An exponential growth curve levels off at