Multiple Choice
Figure 53-4 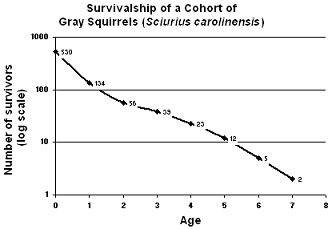 Based on the accompanying figure, which of the following age intervals has the highest death rate?
A) 0 − 1
B) 1 − 2
C) 2 − 3
D) 3 − 4
E) 4 − 5
Correct Answer:

Verified
Correct Answer:
Verified
Related Questions
Q38: Clumped dispersion is often influenced by:<br>A) the
Q45: An exponential growth curve has a J
Q50: The percentages of a population at different
Q66: Oysters have a(n) Type-II survivorship curve.
Q68: Communities are composed of all of the:<br>A)
Q69: What term refers to the average rate
Q70: Write out the growth equation including the
Q71: When the size of a population greatly
Q75: Two members of the same species compete
Q77: Figure 53-4 <img src="https://d2lvgg3v3hfg70.cloudfront.net/TBX8677/.jpg" alt="Figure 53-4