Multiple Choice
Figure 53-6 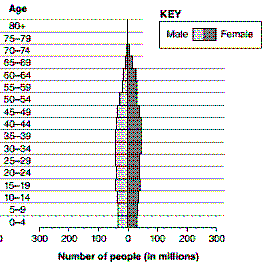 Refer to the accompanying figure. Assuming the pattern remains the same, what will the population experience in 50 years?
A) slow growth
B) rapid growth
C) steady state growth
D) negative growth
E) No prediction can be made using these data.
Correct Answer:

Verified
Correct Answer:
Verified
Q2: Figure 53-6 <img src="https://d2lvgg3v3hfg70.cloudfront.net/TBX8677/.jpg" alt="Figure 53-6
Q4: Figure 53-3 <img src="https://d2lvgg3v3hfg70.cloudfront.net/TBX8677/.jpg" alt="Figure 53-3
Q8: _ generally have greater population densities than
Q10: Which of the following series correctly represents
Q11: What British clergyman and economist was one
Q22: People overpopulation is the current problem in
Q23: Compare and contrast Type I and Type
Q24: Consumption overpopulation occurs when each individual in
Q67: Differentiate between density-dependent and density-independent factors affecting
Q84: An example of a density-dependent factor that