Multiple Choice
Figure 53-6 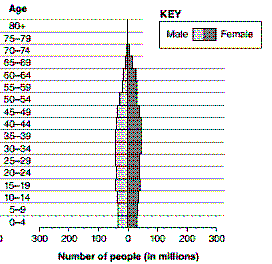 Figure 53-6 represents the age structure diagram of:
A) the transition stage.
B) the preindustrial state.
C) a moderately developed country.
D) a developing country.
E) a highly developed country.
Correct Answer:

Verified
Correct Answer:
Verified
Q4: Figure 53-3 <img src="https://d2lvgg3v3hfg70.cloudfront.net/TBX8677/.jpg" alt="Figure 53-3
Q5: Figure 53-6 <img src="https://d2lvgg3v3hfg70.cloudfront.net/TBX8677/.jpg" alt="Figure 53-6
Q8: _ generally have greater population densities than
Q10: Which of the following series correctly represents
Q11: What British clergyman and economist was one
Q22: People overpopulation is the current problem in
Q23: Compare and contrast Type I and Type
Q24: Consumption overpopulation occurs when each individual in
Q67: Differentiate between density-dependent and density-independent factors affecting
Q84: An example of a density-dependent factor that