Multiple Choice
Figure 8-1
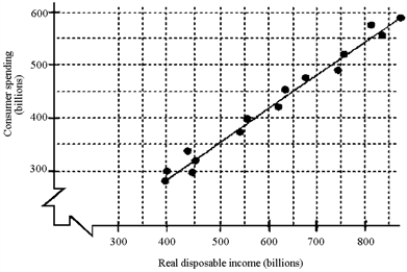
-The slope of the fitted line that shows the relationship between consumer spending and disposable income is the
A) marginal propensity to save.
B) probability of expending.
C) marginal income spend.
D) marginal propensity to consume.
Correct Answer:

Verified
Correct Answer:
Verified
Q59: The largest income component in the national
Q60: Which of the following would be removed
Q61: New residential housing is placed under consumer
Q62: Which of the following would is included
Q63: When GDP is calculated as the final
Q65: Figure 8-1<br> <img src="https://d2lvgg3v3hfg70.cloudfront.net/TB8592/.jpg" alt="Figure 8-1
Q66: The marginal propensity to consume is calculated
Q67: Discuss the major determinants of net exports.
Q68: Whirlpool Corporation buys steel in sheets to
Q69: An increase in stock prices will be