Multiple Choice
Figure 11-3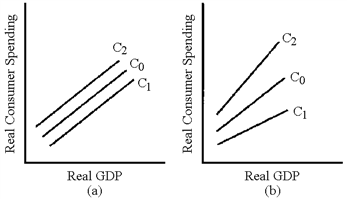
In Figure 11-3, which line represents the change in the consumption schedule caused by an increase in the personal income tax?
A) C1 in graph (a)
B) C2 in graph (a)
C) C1 in graph (b)
D) C2 in graph (b)
Correct Answer:

Verified
Correct Answer:
Verified
Q28: Expansionary fiscal policy can mitigate recessions, but
Q70: The aim of the supply-side tax cuts
Q75: A conservative who was opposed to an
Q106: Figure 11-3<br><img src="https://d2lvgg3v3hfg70.cloudfront.net/TBX9029/.jpg" alt="Figure 11-3
Q112: Table 11-1 <img src="https://d2lvgg3v3hfg70.cloudfront.net/TBX9029/.jpg" alt="Table 11-1
Q117: A reduction in the capital gains tax,
Q144: During the 2008 presidential campaign, candidate Barack
Q168: When we add a personal income tax
Q185: What are the policies usually advocated by
Q193: The difference between a fixed tax and