Multiple Choice
Figure 11-3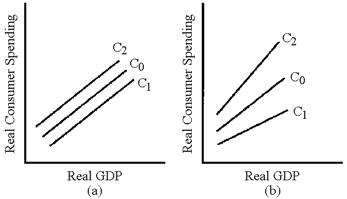
In Figure 11-3, which line represents the change in the consumption schedule caused by an increase in the residential property tax?
A) C1 in graph (a)
B) C2 in graph (a)
C) C1 in graph (b)
D) C2 in graph (b)
Correct Answer:

Verified
Correct Answer:
Verified
Q5: Assume that the federal government wishes to
Q15: A budget surplus occurs when tax revenues
Q28: Expansionary fiscal policy can mitigate recessions, but
Q84: Inflationary gaps can be cured by either
Q110: Figure 11-3<br><img src="https://d2lvgg3v3hfg70.cloudfront.net/TBX9029/.jpg" alt="Figure 11-3
Q117: A reduction in the capital gains tax,
Q168: When we add a personal income tax
Q185: What are the policies usually advocated by
Q192: Which of the following individuals would most
Q193: The difference between a fixed tax and