Multiple Choice
Figure 36 -8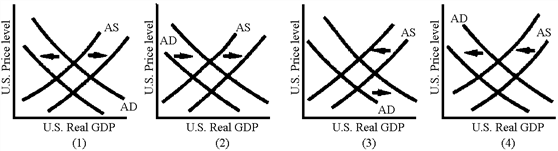
Which of the graphs in Figure 36-8 represents the effects of a currency appreciation?
A) 1
B) 2
C) 3
D) 4
Correct Answer:

Verified
Correct Answer:
Verified
Related Questions
Q21: In an open economy, the government deficit
Q29: Because of their effect on interest rates,<br>A)capital
Q78: A reduction in net exports shifts the
Q81: An appreciation of the Japanese yen would
Q93: Suppose that the Fed decides to decrease
Q116: International capital flows increase the power of
Q127: Figure 36 -8<br><img src="https://d2lvgg3v3hfg70.cloudfront.net/TBX9029/.jpg" alt="Figure 36 -8
Q169: The expected effect of the Bush tax
Q180: If European economies experience a period of
Q209: If the demand effect dominates during a