Multiple Choice
Figure 36 -8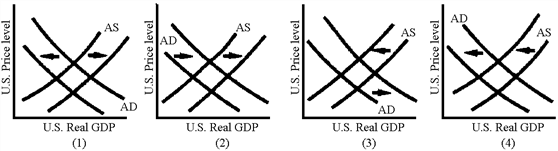
Which of the graphs in Figure 36-8 illustrates the AD-AS shifts associated with an expansionary monetary policy?
A) 1
B) 2
C) 3
D) 4
Correct Answer:

Verified
Correct Answer:
Verified
Related Questions
Q14: Which of the following is correct?<br>A)IM +
Q65: Since the U.S.economy expanded rapidly from 1992
Q71: The sum of current account surplus and
Q78: A reduction in net exports shifts the
Q93: Suppose that the Fed decides to decrease
Q116: International capital flows increase the power of
Q132: Figure 36 -8<br><img src="https://d2lvgg3v3hfg70.cloudfront.net/TBX9029/.jpg" alt="Figure 36 -8
Q172: An expansionary fiscal policy will lead to<br>A)higher
Q174: If the federal government has a deficit,
Q180: If European economies experience a period of