Multiple Choice
Exhibit 2-6 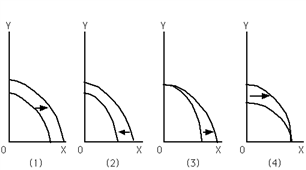
Refer to Exhibit 2-6. Which graph depicts a technological improvement in the production of good Y only?
A) (1)
B) (2)
C) (3)
D) (4)
Correct Answer:

Verified
Correct Answer:
Verified
Q22: Exhibit 2-6 <img src="https://d2lvgg3v3hfg70.cloudfront.net/TBX9059/.jpg" alt="Exhibit 2-6
Q24: Exhibit 2-9 <img src="https://d2lvgg3v3hfg70.cloudfront.net/TBX9059/.jpg" alt="Exhibit 2-9
Q25: Exhibit 2-6 <img src="https://d2lvgg3v3hfg70.cloudfront.net/TBX9059/.jpg" alt="Exhibit 2-6
Q26: The economy can produce 15X and 15Y,
Q29: Exhibit 2-8 <img src="https://d2lvgg3v3hfg70.cloudfront.net/TBX9059/.jpg" alt="Exhibit 2-8
Q30: If the law of increasing opportunity costs
Q32: Exhibit 2-1 <img src="https://d2lvgg3v3hfg70.cloudfront.net/TBX9059/.jpg" alt="Exhibit 2-1
Q35: A person has a comparative advantage in
Q120: Consider two straight-line PPFs.They have the same
Q129: Explain how a technological advancement in one