Multiple Choice
Exhibit 2-6 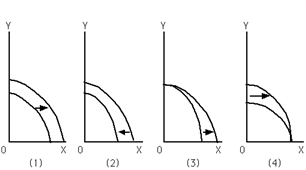
Refer to Exhibit 2-6. Which graph depicts the result of an increase in the unemployment rate?
A) (1)
B) (2)
C) (3)
D) (4)
E) The result of an increase in the unemployment rate is not depicted by any of the graphs shown here.
Correct Answer:

Verified
Correct Answer:
Verified
Q5: Suppose the economy goes from a point
Q17: Exhibit 2-5 <img src="https://d2lvgg3v3hfg70.cloudfront.net/TBX9059/.jpg" alt="Exhibit 2-5
Q18: Country 1 produces two goods, A and
Q21: Exhibit 2-3 <img src="https://d2lvgg3v3hfg70.cloudfront.net/TBX9059/.jpg" alt="Exhibit 2-3
Q24: Exhibit 2-9 <img src="https://d2lvgg3v3hfg70.cloudfront.net/TBX9059/.jpg" alt="Exhibit 2-9
Q25: Exhibit 2-6 <img src="https://d2lvgg3v3hfg70.cloudfront.net/TBX9059/.jpg" alt="Exhibit 2-6
Q26: The economy can produce 15X and 15Y,
Q27: Exhibit 2-6 <img src="https://d2lvgg3v3hfg70.cloudfront.net/TBX9059/.jpg" alt="Exhibit 2-6
Q129: Explain how a technological advancement in one
Q146: A PPF is bowed outward as a