Multiple Choice
Exhibit 19-5 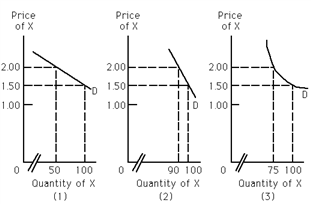
Refer to Exhibit 19-5. Assume that the seller of X increases the price from $1.50 to $2.00, and this results in an increase in total revenue. Which of the graphs could represent the demand curve for X?
A) (1)
B) (2)
C) (3)
D) There is not enough information provided to answer this question.
Correct Answer:

Verified
Correct Answer:
Verified
Q6: If Casey bought 16 cotton t-shirts last
Q26: Suppose a producer decides that if the
Q62: Suppose that when the price of a
Q76: Demand for a given good is inelastic,
Q101: Exhibit 19-7 <br><img src="https://d2lvgg3v3hfg70.cloudfront.net/TBX9059/.jpg" alt="Exhibit 19-7
Q102: Exhibit 19-7 <br><img src="https://d2lvgg3v3hfg70.cloudfront.net/TBX9059/.jpg" alt="Exhibit 19-7
Q104: If demand for a given good is
Q105: Exhibit 19-8 <br><img src="https://d2lvgg3v3hfg70.cloudfront.net/TBX9059/.jpg" alt="Exhibit 19-8
Q118: Income rises from $3,500 to $4,000 a
Q163: Vernon spends the following percentages of his