Multiple Choice
Exhibit 19-7 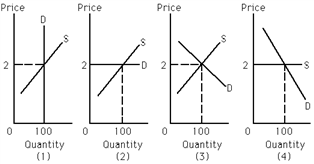
Refer to Exhibit 19-7. Which of the graphs shows a perfectly elastic demand curve?
A) (1)
B) (2)
C) (3) and (4)
D) There is not enough information provided to answer this question.
Correct Answer:

Verified
Correct Answer:
Verified
Q6: If Casey bought 16 cotton t-shirts last
Q26: Suppose a producer decides that if the
Q62: Suppose that when the price of a
Q100: Exhibit 19-5 <br><img src="https://d2lvgg3v3hfg70.cloudfront.net/TBX9059/.jpg" alt="Exhibit 19-5
Q102: Exhibit 19-7 <br><img src="https://d2lvgg3v3hfg70.cloudfront.net/TBX9059/.jpg" alt="Exhibit 19-7
Q104: If demand for a given good is
Q105: Exhibit 19-8 <br><img src="https://d2lvgg3v3hfg70.cloudfront.net/TBX9059/.jpg" alt="Exhibit 19-8
Q106: Exhibit 19-7 <br><img src="https://d2lvgg3v3hfg70.cloudfront.net/TBX9059/.jpg" alt="Exhibit 19-7
Q118: Income rises from $3,500 to $4,000 a
Q163: Vernon spends the following percentages of his