Multiple Choice
Figure 7-1 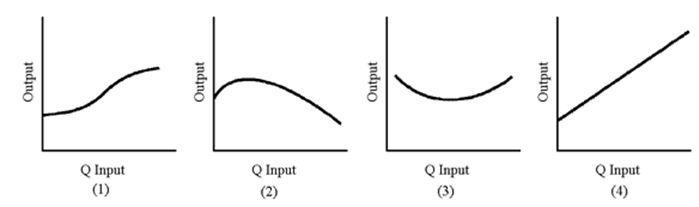
. In Figure 7-1, which graph best represents total physical product with diminishing returns?
A) 1
B) 2
C) 3
D) 4
Correct Answer:

Verified
Correct Answer:
Verified
Related Questions
Q33: Labor is available at a wage of
Q48: Marginal revenue product is essentially the additional
Q61: The rule that states that the marginal
Q101: Figure 7-1 <img src="https://d2lvgg3v3hfg70.cloudfront.net/TB8592/.jpg" alt="Figure 7-1
Q125: For most firms, the short run is
Q133: Figure 7-8 <br><img src="https://d2lvgg3v3hfg70.cloudfront.net/TBX9061/.jpg" alt="Figure 7-8
Q157: Firms choose the highest production indifference curve
Q189: Constant returns to scale for a firm
Q202: The long-run average cost curve<br>A)is a composite
Q212: A production indifference curve shows all combinations