Multiple Choice
Figure 7-11 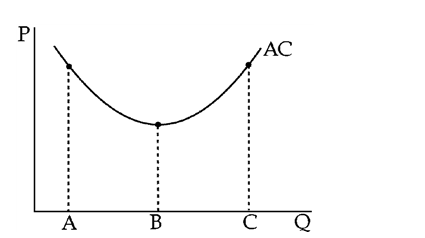
Figure 7-11 shows an average cost curve with points on it that correspond to three quantity levels. Which of the following statements must be wrong?
A) The firm's technology may show increasing marginal returns as production increases from A to B.
B) The firm may have positive fixed costs.
C) As production expands from A to B to C, the firm may become increasingly difficult to manage efficiently.
D) The firm's average fixed cost may rise as production increases from B to C.
Correct Answer:

Verified
Correct Answer:
Verified
Q27: Cost curves in the long run differ
Q47: At a given level of wheat output,
Q98: A firm produces 2,000 high-quality bicycles per
Q118: Figure 7-8 <br><img src="https://d2lvgg3v3hfg70.cloudfront.net/TBX9061/.jpg" alt="Figure 7-8
Q121: The table below gives data on output
Q122: Give a short concise definition for the
Q125: Figure 7-8 <br><img src="https://d2lvgg3v3hfg70.cloudfront.net/TBX9061/.jpg" alt="Figure 7-8
Q127: John Amaker owns orange groves and hires
Q128: Figure 7-2 <img src="https://d2lvgg3v3hfg70.cloudfront.net/TB8592/.jpg" alt="Figure 7-2
Q207: The short-run average cost curve shows the