Multiple Choice
Figure 13-2 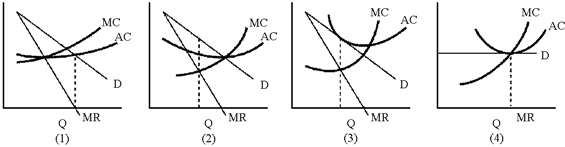
In Figure 13-2, which of the graphs represents a monopolistic competitor in long-run equilibrium?
A) 1
B) 2
C) 3
D) 4
Correct Answer:

Verified
Correct Answer:
Verified
Related Questions
Q6: Explain how short-run and long-run equilibrium in
Q31: Since firms in both monopolistic competition and
Q46: Firms in oligopoly markets are unable to
Q94: Tacit collusion is<br>A)collusion that is carried out
Q100: Markets in which the behavior of the
Q120: Figure 13-3<br> <img src="https://d2lvgg3v3hfg70.cloudfront.net/TB8592/.jpg" alt="Figure 13-3
Q143: Here is an excerpt form an editorial
Q159: What are the advantages and disadvantages of
Q196: Jimmy's java shop operates in a monopolistically
Q248: At any given airport, the airlines hold