Multiple Choice
Figure 3-17 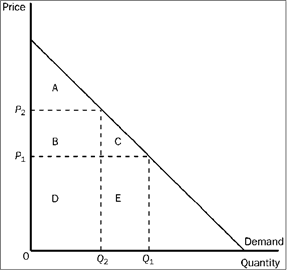
Refer to Figure 3-17. Area C represents
A) the decrease in consumer surplus that results from a downward-sloping demand curve.
B) consumer surplus to new consumers who enter the market when the price falls from P 2 to P 1.
C) the increase in producer surplus when quantity sold increases from Q 2 to Q 1.
D) the decrease in consumer surplus to each consumer in the market when the price increases from P 1 to P 2.
Correct Answer:

Verified
Correct Answer:
Verified
Q27: Other things constant, which of the following
Q102: Two goods are considered substitutes only if<br>A)
Q120: When competition is present and property rights
Q223: A hurricane damaged much of the housing
Q226: Figure 3-22 <img src="https://d2lvgg3v3hfg70.cloudfront.net/TBX9057/.jpg" alt="Figure 3-22
Q229: Figure 3-16 <img src="https://d2lvgg3v3hfg70.cloudfront.net/TBX9057/.jpg" alt="Figure 3-16
Q231: Figure 3-17 <img src="https://d2lvgg3v3hfg70.cloudfront.net/TBX9057/.jpg" alt="Figure 3-17
Q232: Figure 3-17 <img src="https://d2lvgg3v3hfg70.cloudfront.net/TBX9057/.jpg" alt="Figure 3-17
Q260: Suppose both the equilibrium price and quantity
Q358: The efficiency of market organization is dependent