Multiple Choice
Figure 3-22 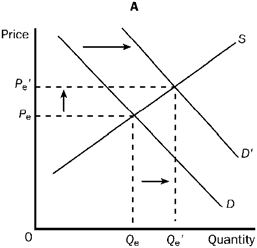
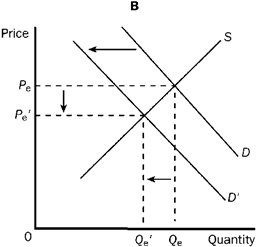
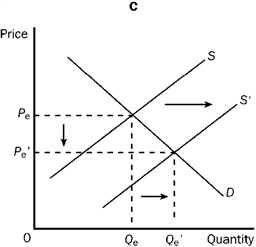
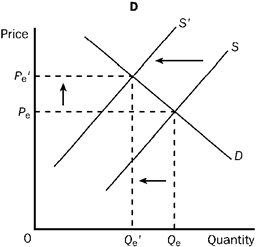
Refer to Figure 3-22. Which of the four graphs represents the market for cars as a result of the adoption of new technology on assembly lines?
A) A
B) B
C) C
D) D
Correct Answer:

Verified
Correct Answer:
Verified
Q27: Other things constant, which of the following
Q66: Ceteris paribus, an increase in the price
Q102: Two goods are considered substitutes only if<br>A)
Q214: If we observe a decrease in the
Q223: A hurricane damaged much of the housing
Q228: Figure 3-17 <img src="https://d2lvgg3v3hfg70.cloudfront.net/TBX9057/.jpg" alt="Figure 3-17
Q229: Figure 3-16 <img src="https://d2lvgg3v3hfg70.cloudfront.net/TBX9057/.jpg" alt="Figure 3-16
Q231: Figure 3-17 <img src="https://d2lvgg3v3hfg70.cloudfront.net/TBX9057/.jpg" alt="Figure 3-17
Q260: Suppose both the equilibrium price and quantity
Q358: The efficiency of market organization is dependent