Multiple Choice
Figure 3-22 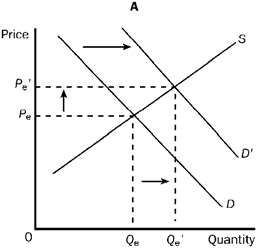
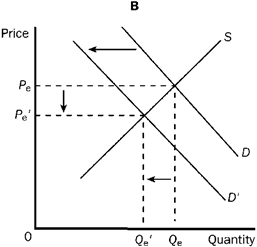
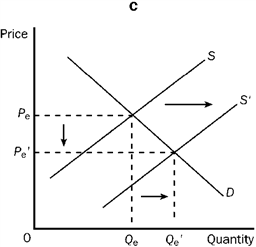
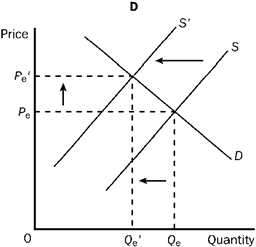
Refer to Figure 3-22. Which of the four graphs illustrates a decrease in quantity demanded?
A) A
B) B
C) C
D) D
Correct Answer:

Verified
Correct Answer:
Verified
Related Questions
Q29: If the quantity of a good supplied
Q147: If the supply of a good increased,
Q253: Prices direct economic activity in a market
Q317: Which of the following would decrease the
Q321: Figure 3-22 <img src="https://d2lvgg3v3hfg70.cloudfront.net/TBX9057/.jpg" alt="Figure 3-22
Q325: Which of the following is true?<br>A) The
Q327: Figure 3-23 <img src="https://d2lvgg3v3hfg70.cloudfront.net/TBX9057/.jpg" alt="Figure 3-23
Q329: Which of the following would most likely
Q367: When property rights are well defined and
Q380: Suppose a person defects from Cuba (a