Multiple Choice
Figure 3-23 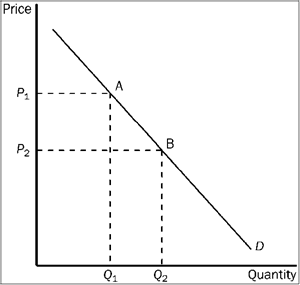
Refer to Figure 3-23. The movement from point A to point B on the graph shows
A) a decrease in demand.
B) an increase in demand.
C) a decrease in quantity demanded.
D) an increase in quantity demanded.
Correct Answer:

Verified
Correct Answer:
Verified
Q29: If the quantity of a good supplied
Q34: When economists say the quantity supplied of
Q147: If the supply of a good increased,
Q177: An agricultural economist reports that corn prices
Q267: In a competitive market economy, a resource
Q322: Figure 3-22 <img src="https://d2lvgg3v3hfg70.cloudfront.net/TBX9057/.jpg" alt="Figure 3-22
Q325: Which of the following is true?<br>A) The
Q329: Figure 3-22 <img src="https://d2lvgg3v3hfg70.cloudfront.net/TBX9057/.jpg" alt="Figure 3-22
Q331: Use the figure below to answer the
Q380: Suppose a person defects from Cuba (a