Multiple Choice
Figure 4-5 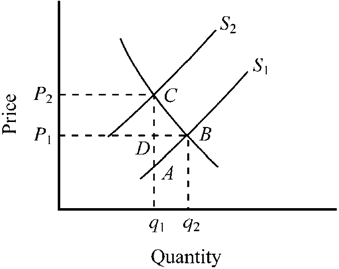
Figure 4-5 represents the market for gasoline before and after a per-gallon tax. What does the triangular area ABC represent?
A) the amount of revenue raised due to imposing the tax
B) the loss in consumer surplus due to imposing the tax
C) the loss in producer surplus due to imposing the tax
D) the deadweight loss (or excess burden) caused by the tax
Correct Answer:

Verified
Correct Answer:
Verified
Q55: Black markets that operate outside the legal
Q102: If a household has $40,000 in taxable
Q142: The statutory incidence (or burden) of a
Q173: The actual burden of a tax is
Q240: The more elastic the supply of a
Q263: The average tax rate is defined as<br>A)
Q321: Figure 4-17 <img src="https://d2lvgg3v3hfg70.cloudfront.net/TBX9057/.jpg" alt="Figure 4-17
Q322: Use the figure below to answer the
Q327: When a tax is imposed on a
Q329: Other things constant, an increase in the