Multiple Choice
Use the figure below to answer the following question(s) .
Figure 4-8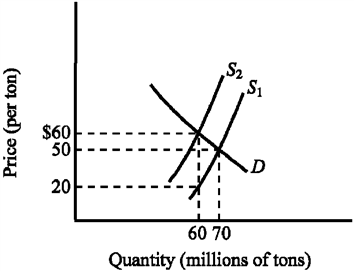
Refer to Figure 4-8. How much revenue does the $40-per-ton tax generate for the government?
A) $600 million
B) $700 million
C) $2.4 billion
D) $2.8 billion
Correct Answer:

Verified
Correct Answer:
Verified
Q25: Economic analysis indicates minimum wage legislation has<br>A)
Q102: If a household has $40,000 in taxable
Q142: The statutory incidence (or burden) of a
Q240: The more elastic the supply of a
Q263: The average tax rate is defined as<br>A)
Q317: Which of the following is true?<br>A) An
Q318: Figure 4-23 <img src="https://d2lvgg3v3hfg70.cloudfront.net/TBX9057/.jpg" alt="Figure 4-23
Q321: Figure 4-17 <img src="https://d2lvgg3v3hfg70.cloudfront.net/TBX9057/.jpg" alt="Figure 4-17
Q325: Figure 4-5 <img src="https://d2lvgg3v3hfg70.cloudfront.net/TBX9057/.jpg" alt="Figure 4-5
Q327: When a tax is imposed on a