Multiple Choice
The graph below depicts the cost structure for a firm in a competitive market.
Figure 9-13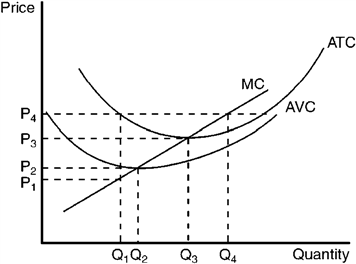
Refer to Figure 9-13. When price rises from P2 to P3, the firm finds that
A) marginal cost exceeds marginal revenue at a production level of Q2.
B) if it produces at output level Q3 it will earn a positive profit.
C) expanding output to Q4 would leave the firm with losses.
D) it could increase profits by lowering output from Q3 to Q2.
Correct Answer:

Verified
Correct Answer:
Verified
Q40: In a competitive market, profit can be
Q60: Figure 9-12 <img src="https://d2lvgg3v3hfg70.cloudfront.net/TBX9057/.jpg" alt="Figure 9-12
Q62: Scenario 9-1 Assume a certain competitive price-taker
Q63: Which portion of the marginal cost curve
Q66: "I'm losing money, but having invested so
Q136: When a law is passed that requires
Q151: When an economist states that a firm
Q167: When a firm is operating in a
Q175: Firms that are price takers<br>A) are small
Q233: When the price of a product rises,