Multiple Choice
Figure 9-12 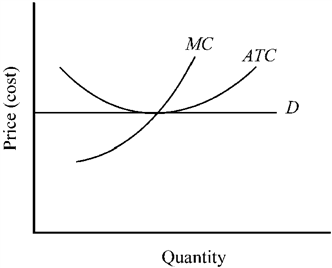
Figure 9-12 illustrates a
A) competitive price-taker firm that is earning economic profit.
B) competitive price-taker firm that is only able to break even when it is maximizing economic profit.
C) firm that should shut down immediately.
D) competitive price-taker firm that is making economic losses.
Correct Answer:

Verified
Correct Answer:
Verified
Q1: In the competitive price-taker model, individual firms
Q55: The graph below depicts the cost structure
Q57: If the demand for a product increases
Q62: Scenario 9-1 Assume a certain competitive price-taker
Q63: Which portion of the marginal cost curve
Q65: The graph below depicts the cost structure
Q66: When the conditions in a competitive price-taker
Q136: When a law is passed that requires
Q175: Firms that are price takers<br>A) are small
Q182: If a price taker in a competitive