Multiple Choice
The graph below depicts the cost structure for a firm in a competitive market.
Figure 9-13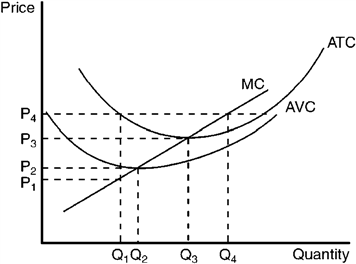
Refer to Figure 9-13. When price falls from P3 to P1, the firm finds that
A) fixed cost is higher at a production level of Q1 than it is at Q3.
B) it should produce Q1 units of output.
C) it should produce Q3 units of output.
D) it should shut down immediately.
Correct Answer:

Verified
Correct Answer:
Verified
Q126: In the long run, in a price-taker
Q126: In the long run, in a price-taker
Q129: In the short run, a profit-maximizing price
Q165: When entry barriers into a market are
Q179: Which of the following is a characteristic
Q196: FYI Sanitation is currently eight months into
Q200: Scenario 9-1 Assume a certain competitive price-taker
Q209: If occupational safety laws were changed so
Q365: Figure 9-1 <img src="https://d2lvgg3v3hfg70.cloudfront.net/TBX9057/.jpg" alt="Figure 9-1
Q368: The schedule of total cost for a