Multiple Choice
Figure 9-1 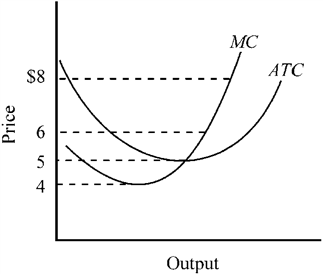
Figure 9-1 shows the marginal and average total cost curves for a firm producing product A. What would be the minimum price this firm could charge and still continue to supply A to the market in the long run?
A) $4
B) $5
C) $6
D) $8
Correct Answer:

Verified
Correct Answer:
Verified
Related Questions
Q126: In the long run, in a price-taker
Q126: In the long run, in a price-taker
Q129: In the short run, a profit-maximizing price
Q165: When entry barriers into a market are
Q179: Which of the following is a characteristic
Q196: FYI Sanitation is currently eight months into
Q209: If occupational safety laws were changed so
Q364: The graph below depicts the cost structure
Q368: The schedule of total cost for a
Q370: Historically, most economists have referred to markets