Multiple Choice
The graph below depicts the cost structure for a firm in a competitive market.
Figure 9-13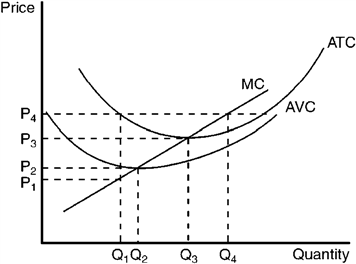
Refer to Figure 9-13. When price rises from P3 to P4, the firm finds that
A) fixed costs are lower at a production level of Q4.
B) it can earn a positive profit by increasing production to Q4.
C) profit is still maximized at a production level of Q3.
D) average revenue exceeds marginal revenue at a production level of Q4.
Correct Answer:

Verified
Correct Answer:
Verified
Q12: In price-taker markets, individual firms have no
Q44: For a certain firm, the 100th unit
Q78: In a constant cost industry,<br>A) a natural
Q81: When new firms enter a competitive price-taker
Q122: Suppose the total cost for various levels
Q124: Figure 9-10 <img src="https://d2lvgg3v3hfg70.cloudfront.net/TBX9057/.jpg" alt="Figure 9-10
Q125: The figure depicts a firm in a
Q126: If firms in a price-taker industry were
Q156: A firm is currently operating where the
Q212: A competitive price-taker firm's marginal cost curve