Multiple Choice
Figure 9-10 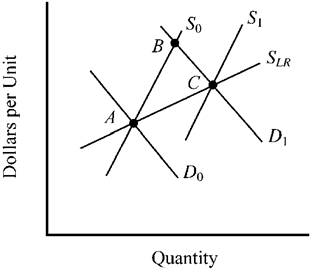
In Figure 9-10, the movement from points A to B to C can best be explained by which of the following factors?
A) a decrease in demand, followed by the entry of new firms and an expansion in supply in a constant cost industry.
B) an increase in demand, followed by the entry of new firms and an expansion in supply in an increasing cost industry.
C) a decrease in demand, followed by the exit of firms and a decline in supply in an increasing cost industry.
D) an increase in demand, followed by the exit of firms and a decline in supply in a constant cost industry.
Correct Answer:

Verified
Correct Answer:
Verified
Q12: In price-taker markets, individual firms have no
Q44: For a certain firm, the 100th unit
Q78: In a constant cost industry,<br>A) a natural
Q81: When new firms enter a competitive price-taker
Q122: Suppose the total cost for various levels
Q123: The graph below depicts the cost structure
Q125: The figure depicts a firm in a
Q126: If firms in a price-taker industry were
Q156: A firm is currently operating where the
Q210: The exit of existing firms from a